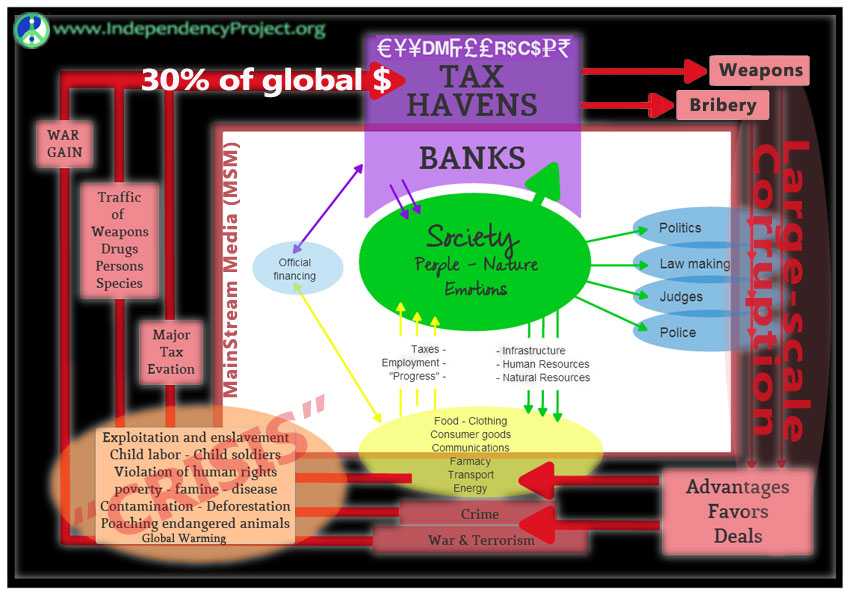
Countries with Bank Secrecy stimulate War, Corruption, Crime...
posted by Admin
on Fri, 21/02/2014 - 14:25
Simple, common logic:
- War, Corruption and Crime are basically financed by Black Money;
- Black Money is hidden on or retrieved from Secret Bank accounts;
- Countries with Bank Secrecy, like Switzerland and England, thus, allow and stimulate War, Corruption and Crime.
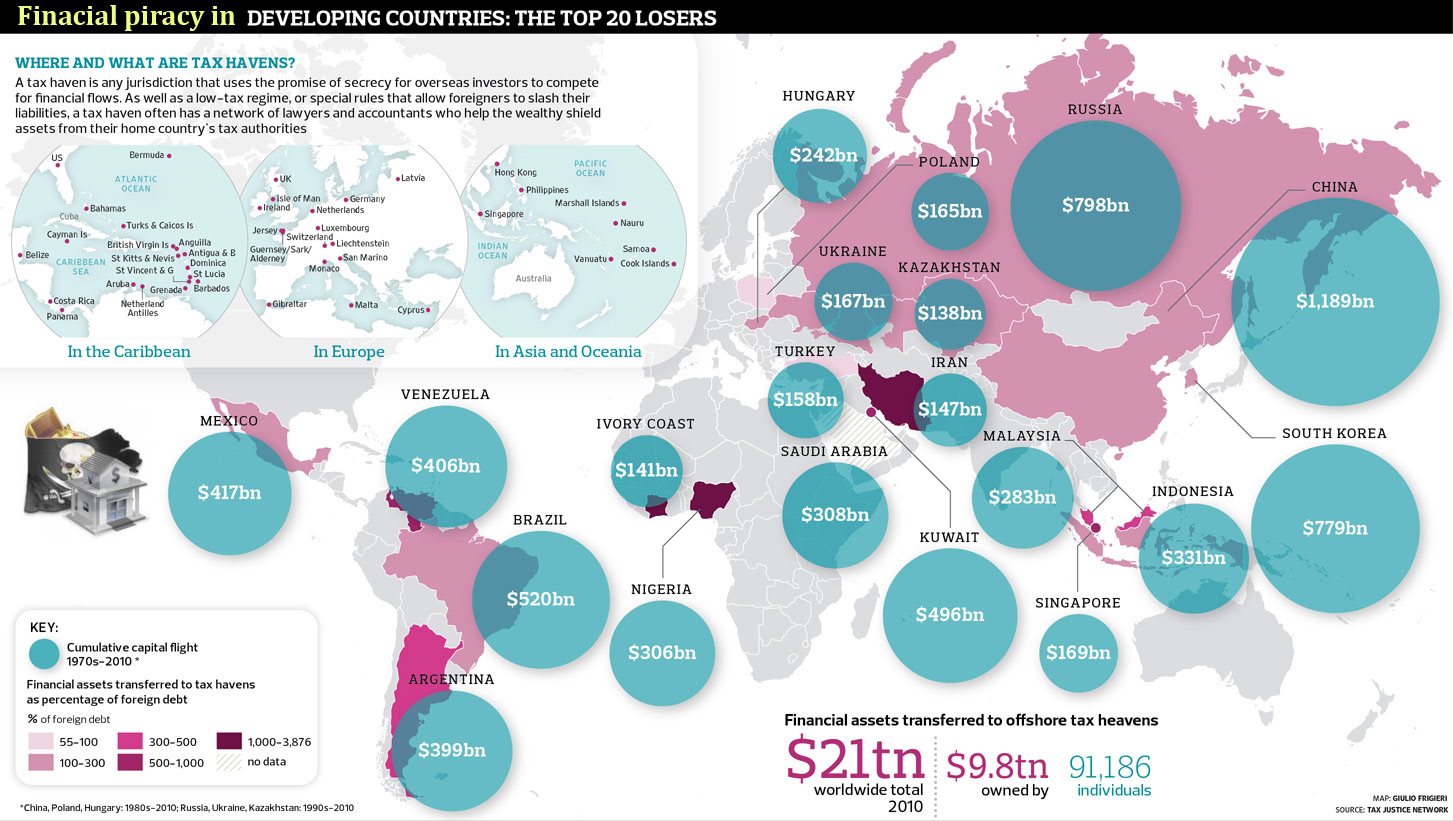
Western leaders look at Africa and blame their leaders for corruption but they don’t recognise that the systems we’ve put in place – above all the tax havens jurisdiction economy – are an open invitation to criminal behaviour, fraud, tax evasion, embezzlement, and non-disclosure. - John Christensen, director of the Tax Justice Network
- Bank secrecy masks a world of crime and destruction (the Guardian)
- Offshore tax havens promote corruption (Tax Justice Network)
The United Kingdom (with dependencies) is the country,
that most allows and stimulates War, Corruption and Crime on the planet.
Country Ranking of Financial Secrecy 2013 according to Tax Justice Network
The sum of UK + dependencies make it the #1 Bank Secrecy and Tax Haven country.
(Links open corresponding pages at FinancialSecrecyIndex.com)
| RANK | Secrecy Jurisdiction | FSI - Value4 | Secrecy Score5 | Global Scale Weight6 |
| 1 | Switzerland2 | 1,765.2 | 78 | 4.916 |
| 2 | Luxembourg2 | 1,454.4 | 67 | 12.049 |
| 3 | Hong Kong2 | 1,283.4 | 72 | 4.206 |
| 4 | 1,233.5 | 70 | 4.694 | |
| 5 | Singapore2 | 1,216.8 | 70 | 4.280 |
| 6 | USA2 | 1,212.9 | 58 | 22.586 |
| 7 | Lebanon2 | 747.8 | 79 | 0.354 |
| 8 | Germany2 | 738.3 | 59 | 4.326 |
| 9 | 591.7 | 75 | 0.263 | |
| 10 | Japan2 | 513.1 | 61 | 1.185 |
| 11 | Panama | 489.6 | 73 | 0.190 |
| 12 | Malaysia (Labuan)3 | 471.6 | 80 | 0.082 |
| 13 | Bahrain2 | 461.1 | 72 | 0.182 |
| 14 | 432.3 | 80 | 0.061 | |
| 15 | 419.3 | 67 | 0.257 | |
| 16 | United Arab Emirates (Dubai)2,3 | 419.0 | 79 | 0.061 |
| 17 | Canada2 | 418.5 | 54 | 2.008 |
| 18 | Austria2 | 400.8 | 64 | 0.371 |
| 19 | Mauritius1 | 397.8 | 80 | 0.047 |
| 20 | 385.4 | 66 | 0.241 | |
| 21 | 361.3 | 40 | 18.530 | |
| 22 | Macao | 360.4 | 71 | 0.108 |
| 23 | Marshall Islands | 329.6 | 82 | 0.022 |
| 24 | Korea | 328.7 | 54 | 0.978 |
| 25 | Russia | 325.2 | 60 | 0.318 |
| 26 | Barbados | 317.4 | 81 | 0.021 |
| 27 | Liberia2 | 300.8 | 83 | 0.014 |
| 28 | Seychelles | 293.4 | 85 | 0.011 |
| 29 | Brazil2 | 283.9 | 52 | 0.768 |
| 30 | Uruguay2 | 277.4 | 72 | 0.040 |
| 31 | Saudi Arabia | 274.2 | 75 | 0.028 |
| 32 | India | 254.5 | 46 | 1.800 |
| 33 | Liechtenstein | 240.9 | 79 | 0.011 |
| 34 | 237.2 | 67 | 0.049 | |
| 35 | Bahamas1 | 226.8 | 80 | 0.009 |
| 36 | South Africa | 209.7 | 53 | 0.260 |
| 37 | Philippines | 206.6 | 67 | 0.033 |
| 38 | Israel2 | 205.9 | 57 | 0.132 |
| 39 | Netherlands2 | 204.9 | 50 | 0.430 |
| 40 | Belgium2 | 199.2 | 45 | 1.031 |
| 41 | Cyprus | 198.9 | 52 | 0.264 |
| 42 | Dominican Republic | 193.7 | 73 | 0.012 |
| 43 | France | 190.9 | 41 | 2.141 |
| 44 | Australia2 | 168.1 | 47 | 0.394 |
| 45 | Vanuatu | 164.9 | 87 | 0.002 |
| 46 | Costa Rica | 157.6 | 71 | 0.008 |
| 47 | Ireland2 | 155.5 | 37 | 2.646 |
| 48 | New Zealand | 151.4 | 52 | 0.126 |
| 49 | 147.8 | 79 | 0.003 | |
| 50 | Norway2 | 142.7 | 42 | 0.667 |
| 51 | Guatemala2 | 142.4 | 77 | 0.003 |
| 52 | Belize | 129.8 | 80 | 0.002 |
| 53 | Latvia | 128.1 | 51 | 0.090 |
| 54 | Italy | 118.9 | 39 | 0.748 |
| 55 | Aruba2 | 113.3 | 71 | 0.003 |
| 56 | Spain | 111.3 | 36 | 1.504 |
| 57 | Ghana2 | 109.9 | 66 | 0.005 |
| 58 | Curacao2 | 106.4 | 77 | 0.001 |
| 59 | US Virgin Islands | 102.8 | 69 | 0.003 |
| 60 | Botswana2 | 98.9 | 73 | 0.002 |
| 61 | 96.7 | 76 | 0.001 | |
| 62 | St Vincent & the Grenadines1 | 85.1 | 78 | 0.001 |
| 63 | 81.8 | 78 | 0.000 | |
| 64 | Malta | 78.0 | 44 | 0.079 |
| 65 | St Lucia1 | 66.8 | 84 | 0.000 |
| 66 | Denmark | 63.1 | 33 | 0.605 |
| 67 | Antigua & Barbuda1 | 60.4 | 80 | 0.000 |
| 68 | San Marino | 59.5 | 80 | 0.000 |
| 69 | Portugal (Madeira)3 | 57.9 | 39 | 0.092 |
| 70 | Grenada1 | 55.7 | 78 | 0.000 |
| 71 | Sweden | 55.7 | 32 | 0.440 |
| 72 | Hungary | 54.6 | 40 | 0.056 |
| 73 | Brunei Darussalam1 | 50.6 | 84 | 0.000 |
| 74 | Andorra | 43.3 | 76 | 0.000 |
| 75 | Monaco | 38.8 | 75 | 0.000 |
| 76 | Samoa | 31.0 | 88 | 0.000 |
| 77 | Dominica1 | 26.9 | 79 | 0.000 |
| 78 | Cook Islands1 | 25.2 | 77 | 0.000 |
| 79 | Maldives | 21.0 | 79 | 0.000 |
| 80 | St Kitts & Nevis1 | 18.4 | 80 | 0.000 |
| 81 | Nauru | 0.0 | 79 | 0.000 |
| 82 | 0.0 | 74 | 0.000 |
| Footnote 1: The territories marked in Dark Blue are "overseas territories" (OTs) and "crown dependencies" (CDs) where the Queen is head of state; powers to appoint key government officials rests with the British Crown; laws must be approved in London; and the UK government holds various other powers (see here for more details). Those marked in light blue are those British commonwealth territories which are not OTs or CDs but whose final court of appeal is the Judicial Committee of the Privy Council in London (see here for more details). If the Global Scale Weights of just the OTs and CDs were added together (24% of global total), and then combined either with their average secrecy score of 70 or their lowest common denominator score of 80 (Bermuda), the United Kingdom with its satellite secrecy jurisdictions would be ranked first in the FSI by a large margin with a FSI score of 2162 or 3170, respectively (compared to 1765 for Switzerland). Note that this list excludes many British Commonwealth Realms where the Queen remains their head of state. [In other words, the Queen of England - richest person of the world in assets - is the last and final person, responsible for allowing the existence of Bank Secrecy in the Commonwealth OTs and CDs - feel free to continue this train of thought, applying common logic.] |
||||
| Footnote 2: For these jurisdictions, we provide special narrative reports exploring the history and politics of their offshore sectors. You can read and download these reports by clicking on the country name. | ||||
| Footnote 3: For these jurisdictions, we took the secrecy score for the sub-national jurisdiction alone, but the Global Scale Weight (GSW) for the entire country. This is not ideal: we would prefer to use GSW data for sub-national jurisdictions - but this data is simply not available. As a result, these jurisdictions might be ranked higher in the index than is warranted. | ||||
| Footnote 4: The FSI is calculated by multiplying the cube of the Secrecy Score with the cube root of the Global Scale Weight. The final result is divided through by one hundred for presentational clarity. | ||||
| Footnote 5: The Secrecy Scores are calculated based on 15 indicators. For full explanation of the methodology and data sources, please read our FSI-methodology document, here. | ||||
| Footnote 6: The Global Scale Weight represent a jurisdiction's share in global financial services exports. For full explanation of the methodology and data sources, please read our FSI-methodology document, here. |
- Log in to post comments


